Load average:
Normally when we talk about system load we talk about the system load average. System load average is equal to the average number of processes in a runnable or uninterruptible state. For a single CPU host, a load average of 1 means the single CPU is under constant load, a load average of 4 means there is four times the load on the system than it can handle, if you translate that into processes, this means three out of four processes are waiting for resources. For a two CPU system, a load average of 1 means one of the CPUs is loaded (Whole system is 50% loaded).
load average of 1 (One CPU) = load average of 4 (Four CPUs)
Check load average:
If a host is slow, usually the first thing you should check is the system load average. You can use "uptime" or "top". Below are two examples:
uptime:
# uptime
 14:40:20 up 20 days,  5:21,  7 users,  load average: 2.34, 16.02, 20.14
top:
# top
top - 14:40:44 up 20 days,  5:22,  7 users,  load average: 2.34, 16.02, 20.14
Tasks: 353 total,   2 running, 351 sleeping,   0 stopped,   0 zombie
Cpu(s):  2.6%us,  0.3%sy,  0.0%ni, 96.6%id,  0.4%wa,  0.0%hi,  0.0%si,  0.0%st
Mem:   7857292k total,  3143728k used,  4713564k free,    16764k buffers
Swap:  5898232k total,        0k used,  5898232k free,   513396k cached
The three numbers after "load average" represent the 1, 5, and 15 minute load average. From these three numbers you can tell the aproximately the spike time. In my example, load average of the system is decreasing. For the past 15 minutes, the load average is very high, for the past 10 minute the load average decrease to 16.02.
Once you identified that it is the high load average that is causing the slow response, the next step is to determine whether the load is CPU-bound, RAM Bound, or I/O-bound.
Determine what caused high load average:
Based on my experience, when system is under CPU-bound load, it appears more responsive than it under I/O-bound load. A system that runs out of memory often appears to have I/O-bound load.
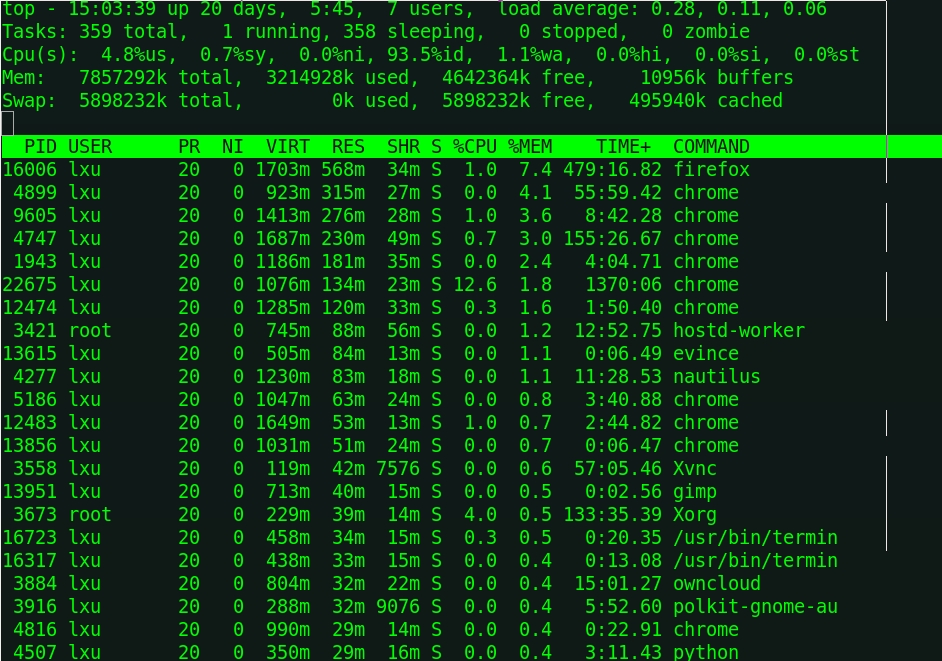
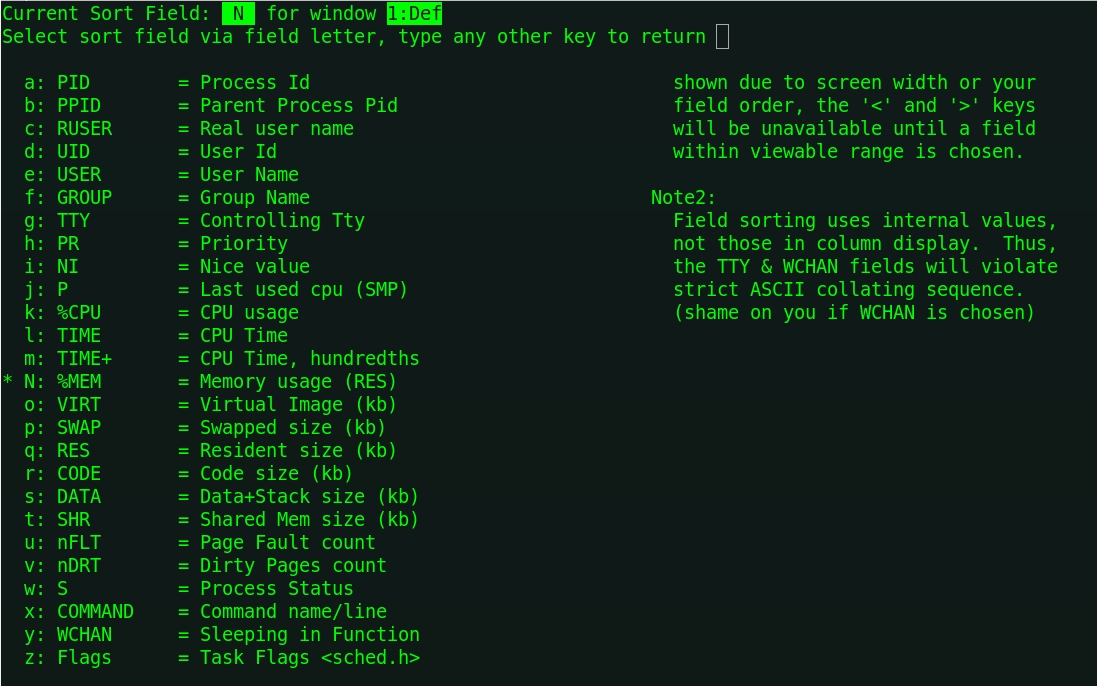
You can use “top” command to diagnose. It allows you to see live information about the system. By default “top” sorts processes based on CPU. You can sort by other fields such as “%MEM, USER, UID, ..etc” by typing “F” in top.
Once you figure out which resource is consumed the most, you can identify what process is the most expensive consumer.
iotop:
Since Linux kernel 2.6.20 there is a much simpler tool for you to diagnose IO/wait issue called “iotop”. It is included in Debian based distribution but for Red Hat you need to install it from a third-party RPM.
iotop Pre-requisites
- Kernel 2.6.18
- Python 2.4 with ctypes module
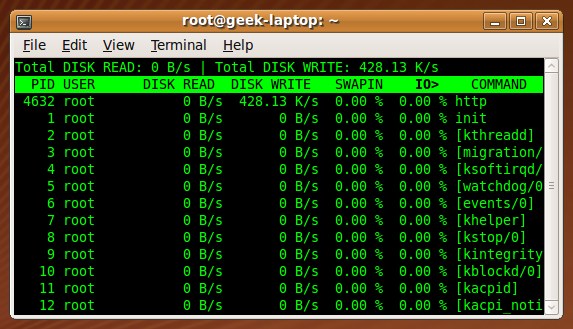
(picture source)
Out of Memory:
One thing you need to pay attention while diagnosing “out of memory” issue. Take a look at the following output;
Line1: Mem:   7857292k total,  3809776k used,  4047516k free,    17776k buffers
Line2: Swap:  5898232k total,        0k used,  5898232k free,   679204k cached
Line1 tells us the total RAM, used RAM, free RAM and buffered RAM. Line2 tells us the swap usage. You need to pay attention to “cached” files when count available memory. Because when Linux loads a file into RAM, it doesn’t necessarily remove it from RAM when a program is done with it. If there is RAM available, Linux will cache the file in RAM in case if a program needs the file again. You should subtract cached files from used RAM. In our case is 4047516k + 679204k = 4726720k.
No comments:
Post a Comment